What is a sale-to-list ratio in real estate?
The sale-to-list ratio is a key real estate metric that compares a home’s final sale price to its original listing price, expressed as a percentage. It tells you how close a property sold relative to what it was listed for. This essentially shows you how effectively a home was priced and sold in the market.
For sellers, a good sale-to-list ratio is anything above 100%. This means that homes are sold above asking price. Meanwhile, for buyers a good sale-to-list ratio is anything below 100%, as this means homes are sold below asking.
Why is the sale-to-list ratio important?
The sale-to-list ratio is important for two main reasons:
- First, it helps you to determine if you are in a buyers or sellers market.
- Second, it can be used to evaluate local realtor performance.
Let’s say that in your local market, the sale-to-list ratio is greater than 100%. This means that you are currently in a sellers market. This means that homes are selling above their asking price and competition among buyers is high. For sellers, this therefore represents a chance to get a high sale price for your property. By contrast, if you are a buyer, you will probably need to make an offer over asking, just to have the offer considered.
By contrast, if the sale-to-list ratio is lower than 100%, this means that you are currently in a buyers market. In this case, there are more sellers than there are buyers. As such, buyers have their pick of the best properties and can take their time when making an offer. Sellers meanwhile may be rushed to accept offers, especially if their properties have been sitting on the market for a long time.
Next, by comparing your relators historical performance to the historical sales-to-list ratio for your local market, you will be able to tell how well your relator has performed over time. Just ask yourself, has their sale-to-list ratio been consistently better or worse than the market over the past few years.
How to calculate the sale-to-list ratio?
The sale-to-list ratio is calculated using the following formula.
For example, consider two neighbours with identical properties that sell at exactly the same time. Neighbour A sells their home at $500,000 and sells it at $525,000 and Neighbour B lists their home at $525,000 and then sells their home for $550,000. The image below shows the sale-to-list ratio for each property sale.

- For Neighbour A, 105% is calculated as (525,000 / 500,000) * 100 = 105%
- For Neighbour B, 104.8% is calculated as (550,000 / 520,000) * 100 = 104.8%
What is interesting about this example is that even though Neighbour B made $25,000 more than Neighbour A, Neighbour A still has a higher sale-to-list ratio. This is a funny thing about this calculation. A broker may choose to deliberately list above market price, because they want to because they want to signal exclusivity and attract buyers who associate higher prices with higher quality. Whereas, in other cases, it may actually be better to deliberately underprice a property so as to attract more potential buyers and drive up the price.
So, the question is, what impacts the sale-to-list ratio and how can we interpret it.
What impacts the sale-to-list ratio?
There are four main things that can influence the sale-to-list ratio. These are:
Let’s take a look at each of these now.
Market conditions (supply & demand)
In a sellers market, demand is high and supply is low. This means that many buyers will be competing over the same small number of homes. As such, in a sellers market, sellers will get multiple offer on their properties and as such, the properties will often come in over asking. By contrast in a buyers market, where supply is high and the demand is low, buyers have their pick. In this kind of market, properties will often come in below their sale-to-list ratio.
Seasonality can affects supply and demand. For instance, some months are stronger for sales than others. However seasonal demands is different depending on the property type and location.
Realtor skill
For realtors, the sale-to-list ratio is like their batting average.
A realtor who carries a 105% sale-to-list ratio over a 20 year period clearly knows what they are doing. Whereas you should probably avoid working with a realtor whose sale-to-list ratio is less than 100%.
Although the market conditions do, to a certain extent, determine what the sale-to-list ratio is, a good broker can clearly influence the price that a property is sold at. This can be done by:
- Setting a smart, data-driven listing price that attracts strong early interest without undervaluing the property.
- Staging and presenting the home well so buyers perceive higher value.
- Running an effective marketing campaign that reaches the right buyers at the right time.
- Negotiating strategically to maximize offers and keep leverage during counteroffers.
- Timing the listing to align with high-activity periods in the local market.
Of course, as we have already seen, a good sale-to-list ratio can be influenced by broader market conditions. However, a realtor who consistently performs well across different market cycles demonstrates genuine skill and not just good luck. Therefore, if you are evaluating an agent, you should ask to see their sale-to-list ratio over the last few years that they have been in business.
Property specific factors
A home’s condition, presentation, and unique features impact the type of buyers that it attracts.
For example, a well-maintained home townhouse in high demand neighbourhood, with quality upgrades, fresh paint, modern finishes, and strong curb appeal will attract a lot of very strong offers. The home will get even more offers if it is decluttered, well staged, and minor repairs are completed. This is because it will shift a buyer perception and justify a higher price.
On the other hand, homes in low demand areas, that are poorly presented, outdated, and require significant work typically sell for less than asking. This isn’t necessarily a reflection of the realtor or the market. It is simply the way buyers compare value. In short, buyers want the properties in great locations that look the best.
Now, of course, everyones view of what “best” is is different, and a good realtor will help you position a property for a particular type of buyer. So, there will still be a market for a “fixer upper”, but the market will be smaller than the mainstream market of buyers who want the best looking property at the best price.
How do I find the sale-to-list ratio in my market?
Understanding the sale-to-list ratio in your local market is an important part of preparing to buy or sell a home. This metric gives you a snapshot of current market behaviour and helps you plan your strategy with more confidence. In this section we take a look at how you can find the sale-to-list ratio for your area.
1. Online real-estate platforms
Some online real-estate platforms publish sale-to-list ratios. For instance, centris.ca publishes up to date snapshots of the Montreal market.
However, you need to be aware of two things here.
- First: these reports tend to be snapshots of the market. They do not give you access to historical market trends. This makes it hard to assess a brokers performance in context.
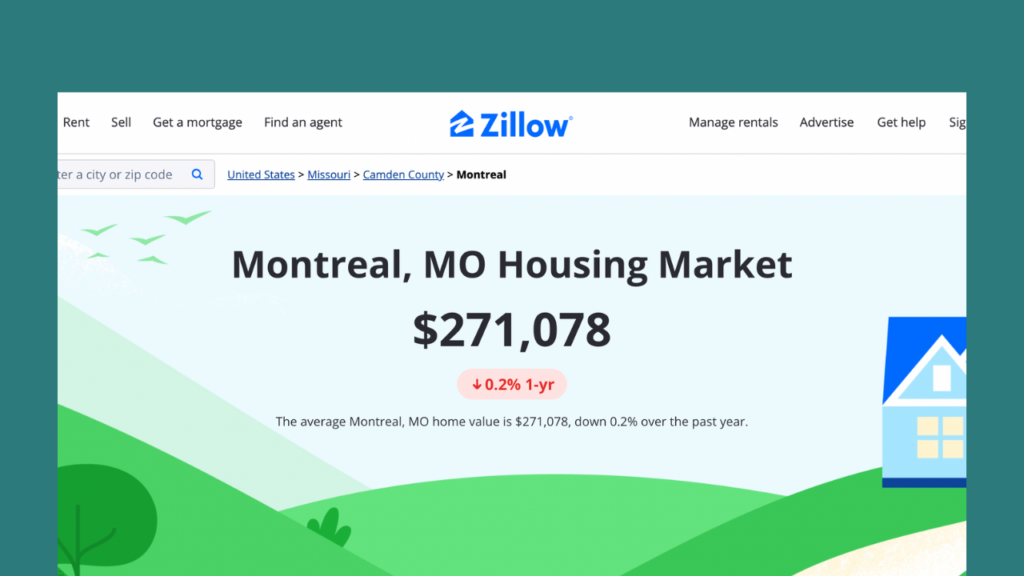
- Second: unless you use a Canadian specific platform, you are unlikely to find trends at the neighbourhood level. For instance, Zillow published (in Q4 2025) that the average house price in Montreal was $271,078. However, this number is essentially irrelevant because the average semi-detached house price on the West Island was around $600,000, whereas the average semi-detached in Little Burgundy was more than $1 million.
2. Ask a local agent
Another way to find the sale-to-list ratio in your neighbourhood is to ask a real-estate agent. Local realtors should have the most accurate and up to date market insights. However, what we have found is that most realtors and their agencies do not have systems in place to calculate this. However, the realtors in Quebec still have access to this data through a system called “Matrix” which is the Multiple Listing Service (MLS) platform used by real estate brokers in Quebec.
Real-estate guru Elen Wheelock says, “Hire the right agent, and they will guide you through it. One of the things that my team does, and I know some other teams do, is they actually track weekly home sales as well as what’s going into contract and what’s coming on the market. That allows us to really see the data this week, next week, and the week before to see trends.”
To find a local realtor check out our free broker matching tool. This is a human in the loop AI that analyzes more than 17,000 licensed realtors in Quebec to shortlist the top performing agents in your local market.
3. Real-estate market reports
Lastly, you can scour the internet for real-estate market reports from reputable market sources. Some of the top top real-estate market reports in Quebec are:
- CMHC (Canada Mortgage and Housing Corporation) — Housing Market Outlook & regional reports. CMHC produces national and regional housing-market outlooks, supply reports, and housing-market monitors that include Montréal/CMA analysis and forward forecasts. These are great for macro context and supply/affordability insight.
- Teranet — National Bank House Price Index — House Price Index (HPI) for major CMAs. The Teranet–National Bank HPI is a high-quality price-index that tracks price movements over time for Montréal (and other CMAs). Use it for longer-term price trends and month-to-month index movements.
- APCIQ (Association professionnelle des courtiers immobiliers du Québec) — Baromètre résidentiel / regional market bulletins. APCIQ (the professional association for Quebec brokers) issues the Baromètre résidentiel and regional market commentary with sales, listings, median prices and market pressure indicators for Greater Montréal. Good for quarterly professional analysis.
Final remarks
The sale-to-list ratio is an important metric in real estate. It can serve as a strong indicator of market trends and a realtor’s ability to price and sell properties effectively.
However, it should never be considered in isolation. To accurately interpret this ratio, you need to view it in the context of the wider market, including seasonal shifts, supply and demand, and neighbourhood specific conditions.
For a complete picture of a broker’s performance, it’s also important to examine additional transaction data, such as days on market, sale price relative to neighbourhood averages, number of offers received, and how the property was positioned and marketed. By combining these insights, you can make informed decisions when choosing a realtor or setting expectations for your own sale.